Big Data – Challenges for Housing Providers.

This article discusses the challenges housing providers face with respect to the data and legislative changes and addresses the journey of overcoming the issues presented.
Understanding and complying with the mass of Government papers and legislation driving action on tackling fuel poverty can present a challenge. Across the country there’s a push for energy efficient housing stock and maintenance of fair fuel pricing policies, as well as funding mechanisms such as ‘ECO’ to encourage property improvements. The Clean Growth Strategy has set the scene for the long term aims of decarbonising our working and living environments, and it is without question that most of these legislative drivers are driving behaviour in the right direction, but is this enough? What is especially challenging, is how to pull everything together in a meaningful way that ensures effective progress towards clean growth targets. There is also the need to make appropriate decisions around tackling fuel poverty and draw on any funding opportunities to assist with budgetary constraints for stock improvements.
Seeing the wood for the trees
Housing providers responsible for maintaining properties face a continuous struggle managing their housing data to enable strategic improvement decisions for the stock as a whole, and also considering each property and tenant in isolation. Whilst asset management system software exists to assist, there are a number of points to consider that are vital in successfully managing and improving housing stock, which are:
- the quality of data available
- the effective consolidation of data sets from different sources (e.g. EPCs, Gas Safety certificates, condition surveys, maintenance paperwork etc.)
• confidence in the information collected.
100% data quality, 100% confidence in the data and 100% effective consolidation of data from multiple sources sounds ideal, but for most this has become the holy grail. However, much like any mammoth task, taking small steps in the right direction and consistently striving to increase the percentages in each of these areas can make the vision a reality.
Where to start?
The best place to start is to understand the quality of the data that decisions are made from. Often, the most efficient investment in the early stages can be consolidating and cleansing the data. This allows the confidence to begin forecasting long-term improvement strategies: modelling the carbon savings and energy efficiency impact.
With clean, consolidated data, a simple question like ‘how much will it cost to get all of my housing stock to a SAP rating of C by 2030?’ can be a useful starting point. Helpfully, along with SAP ratings, EPC data provides recommendations for energy efficiency improvements and includes indicative costings. These can provide a good ‘finger in the air’ calculation in terms of the capital spend on stock required.
Quality of data
Gathering an accurate insight of the properties by physically going out and inspecting them can often be quite fragmented and does not always provide reliable and consistent information. The probable reason for this is because the individual visiting the property would be capturing the additional data as a by-product of the intended reason for the visit. For example, if a heating engineer visits 7 or 8 properties each day to conduct servicing or maintenance, spending additional time to collect information on the boiler, controls, and any other energy efficiency data would not always be at the top of their agenda. App-based data capture has certainly helped in recent years, but there is still a lot more that can be done. The power of educating field teams on the importance of accurate data capture – and the consequences of not doing so – should not be underestimated.
Consolidation of data
For every property within a housing stock there exists a vast quantity of information. Data on each property is not always linked together. For example, data collected during stock condition surveys or boiler maintenance checks can be invaluable in updating energy information. The starting point for this would be to review the energy data and see if there is any more up-to-date information that has been collected for other reasons. Making the most of all the data you hold is key.
Confidence in the information
As well as consolidating and cleansing data, there needs to be confidence in the validity of that data. Is there a compliance process in place to check the data before it is ‘filed away’ and used to inform decision making? Making effective use of data is a process and the end goal should be in sight. To get started we should be lining up the relevant legislation in front of us and considering all elements appropriately before making any big decisions. During the whole process, your level of confidence in the data from which you act upon, should improve. Many housing providers I speak with haven’t quite established enough confidence to rely solely on utilising their asset management systems for making effective decisions around their stock (and I’m sure there will still be a big pile of spreadsheets all over the place acting as an in-house security blanket in the meantime). However, the evolving world of big data means we must all begin working towards a consolidated, single version of the truth. We don’t need to look too far back to recall that the majority of the incoming information regarding housing stock that came from void inspections, inventories, improvement work etc., was just written on a piece of paper and often completely illegible. So, on reflection, there has been impressive progress, but there is still much room for improvement, and there is a need to act sooner rather than later to achieve the end goal.
Are there any ‘quick wins’?
Assuming the data is consolidated and cleansed and you are satisfied that you have good-quality, accurate data, you could consider undertaking some desktop-based activities that identify easy actions to increase the SAP rating of your stock – all from the comfort of your own desk.
To demonstrate this, I have gathered some examples by utilising ‘Intelligent Energy’ (Sava’s data analysis tool). However, it could equally be achieved with other similar products or even a well organised spreadsheet.
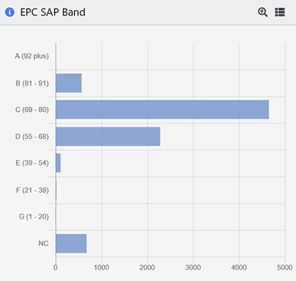
Below is a snapshot of overall SAP bands, based on a stock of 8,000.

Figure 1
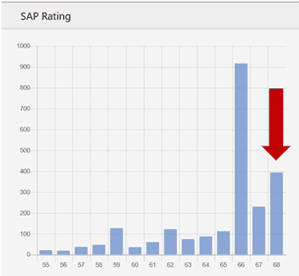
As each SAP band is broken down into specific ratings from 1-100 this information can be used as a starting point to interrogate the data to find opportunities. Some of the properties in SAP band D (55-68) will only be one or two SAP points away from reaching band C. This means you can identify properties that may only require minor measures to push them into the higher band. If we look at figure 2 below, we can see that there are nearly 400 properties which will move into band C with just one more SAP point.

Figure 2
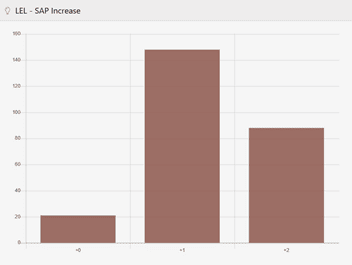
The data can then be interrogated a little further to see the recommended measures that could be applied in order to improve the energy efficiency of the properties and get them into band C. The recommended measures can be analysed to locate the measures that achieve the lowest cost per SAP point increase. Figure 3 below shows one of the many available measures in Intelligent Energy.

Figure 3
This recommendation is for Low Energy Lights (LEL). It shows there are over 140 homes which will benefit from a 1 SAP point gain and around 90 properties will benefit from 2 SAP points if 100% low energy lights were installed.
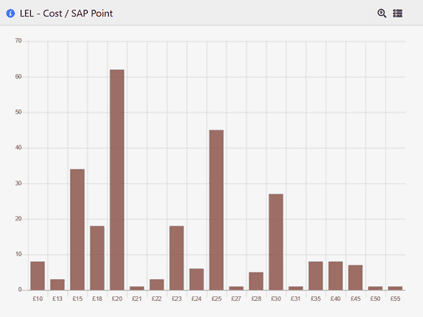
The chart in figure 4 shows the cost per SAP point for low energy lights. This is the install cost of the recommendation divided by the SAP point change. A lower figure means the measure would be more cost effective in terms of a SAP point improvement. This SAP point change is a cumulative change and assumes that other recommended measures have been installed.

Figure 4
If you choose to issue low energy bulbs to the tenants of these properties (or you are confident that they already have them and the data is incorrect), you can now export the list of properties, update the data and recalculate within your asset management system. This will take over 200 homes into band C in a cost-effective way.
As another example, the lack of a boiler index number (PCDF index) could mean the SAP rating is several points lower than it could be – just by entering this information you could increase the SAP rating, pushing some properties into a higher SAP band.
These are just two examples but there are many other cases that can improve the energy efficiency of your stock by using a similar approach. If this type of analysis is brought into your processes as a part of your overall compliance regime, it will consistently provide you with more confidence in your data as well as moving the SAP ratings in the right direction.
Finding a balance
It goes without saying that there should be a balance between hitting targets and providing warm, energy efficient, healthy homes for tenants. While a plan to improve stock based on quality data analysis can be relatively straightforward, reacting and responding to the needs of the customer and, indeed, the property will also drive a lot of the improvement behaviour. This is where having more confidence in your inherent data can consistently improve homes in the most cost-effective way. For instance, by checking when boiler replacements are taking place, and ensuring that any quick, low-price wins such as low energy lighting or a cylinder jacket being installed during the visit can be beneficial to both the customer, the SAP rating and to the budget.
If you want to find out more about how we can support you with your SAP targets and De-Carbonisation programmes you can get in touch with us on 01908 672787.
Andy Flook, Business Development Director, Sava
Andy Heads Up Our Market development and customer management team. Andy’s career started as an apprentice engineer with British Gas,
after which he set up his own nationwide engineering training company and certification body for the Energy and Utility industry before joining Sava in 2013.