How Materials Recover After a Flood or Other Water Damage.

People often assume that the recovery time of buildings affected by an escape of water or flood is mainly dependent upon the duration of the flood event. The reality is, however, that the duration of the event often has less influence on the recovery and the main factors are related to the method of construction, material composition, barriers to drying and chosen drying techniques. In this article, Russell Rafton shares with us the results of an experiment he carried out to demonstrate how materials recover after a flood or water damage.
Consider a hypothetical scenario of two properties affected by a flood.
The first property is affected by a flash flood caused by a failure of the roadside storm drain with the ingress of water through the building up to 600mm high. The incident lasted no more than 16 hours before the flood water was pumped out.
Property number two is affected by a fluvial flood event where water entered the building from a nearby river that burst its banks. Water entered the building also up to 600mm high, and the whole event lasted around four days before the water subsided.
Assuming both properties were constructed from the same materials and exposed to the same drying conditions, which property has the quickest recovery time: the flash flood or the fluvial flood?
Most would assume the flash flood as the event had the shortest duration. But is this assumption correct?
When a building is flooded or suffers water ingress, the water migrates into the capillary pores of the construction material. The longer the water is in contact with the material, the more time water molecules have to climb (rise) and bond to the capillary walls. This water loading, however, can only occur until the capillaries are full, once full the material is saturated and can take up no more additional water. The quantity of water loading (uptake) a material can absorb depends upon its mass, density, and capillary pore structure. A soft, porous brick, for example, will likely absorb more water than say a dense engineering brick, because it has more capillaries and unlike the engineering brick, it is not designed resilient to water and frost. Most masonry materials, however, irrespective of their design, mass or density will saturate in a relatively short period, usually within 10-12 hours.
So, to demonstrate how materials recover after a flood or water damage event, I set up an experiment.
The experiment
I sourced two samples each of several building materials, including:
- LBC facing bricks
- Solid farmhouse bricks
- Engineering bricks
- A cured sample of render (this would be my equivalent of the brick mortar)
The samples were weighed upon purchase using scientific scales which measure down to 0.5 grams and then stored in our laboratory for just over a month. The samples were repeatedly weighed until their weight or weight loss became static over a period of 48 hours. This allowed any free/excess moisture within the samples to evaporate and the material to become equilibrium dry with the environment in our lab.
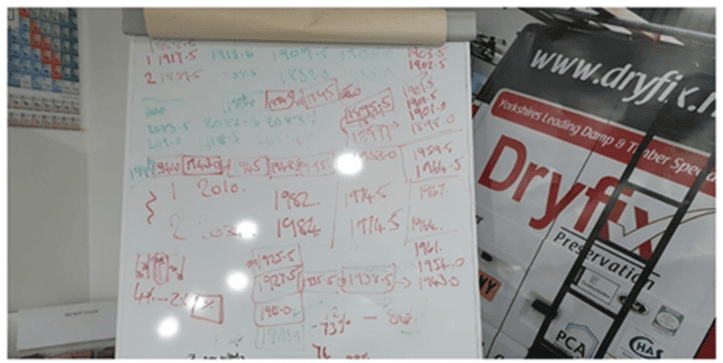
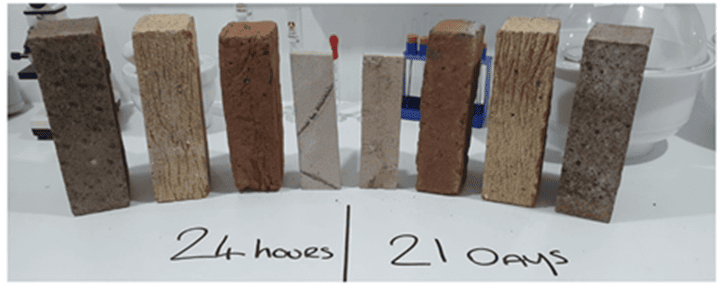
Figure 1: Record of measurements taken during the initial drying phase
Figure 2: Sample materials used for the experiment.
Once I was able to determine all the samples were dry, I recorded their dry weight, and the experiment began.
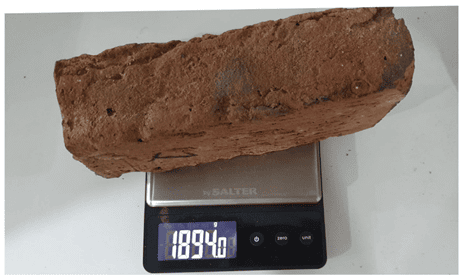
Figure 3: Weight of farmhouse brick before experiment
Firstly, I submerged one of each sample into a bucket of water. The samples were left to soak in the water for a total of 21 days. On day 20, I put the remaining other samples in another bucket of water and left them for just 24 hours.
Finally, I removed all samples, reweighed them to measure their capillary water uptake and simply left them aside in the lab to dry naturally. I reweighed each sample daily to monitor their drying/recovery time.
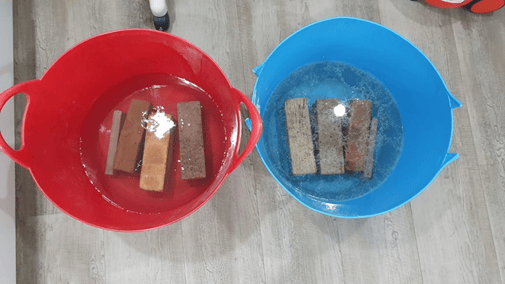
Figure 5: Samples submerged in water
For the following two months, I reweighed each sample on almost a daily basis recording the new weight as a measurement of water loss through evaporation. I would consider the material once again dry when it finally achieved its prior-to submersion equilibrium dry weight.
Since all the materials were subjected to the same drying conditions, i.e., the atmospheric conditions in the lab, I consider the demonstration fair as each material’s drying rate is therefore dependent upon its physical structure. (Disclosure – at the very end of the experiment, the very last sample was subjected to more favourable conditions for a short period to speed up its drying/recovery which was taking an unprecedented amount of time).
So, between the engineering brick, farmhouse, LBC, and mortar sample, which had the greatest water uptake?
The results
The image below demonstrates the uptake of water in each sample submerged for 21 days.
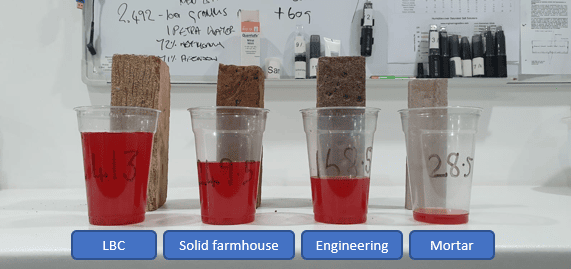
Figure 6: equivalent water uptake of each sample
The brick which had the largest water uptake in both samples was the LBC brick. The LBC is a rather lightweight common facing brick with a large frog in the middle to reduce its mass and inevitably production cost. The frog also improves brick bonding as a physical key. The LBC bricks had a water uptake of 413 grams for the 21-day submersion and a similar 404 grams for the 24-hour submersion. This results in a staggering weight increase the equivalent of 21.1% and 21.4% of the bricks total weight.
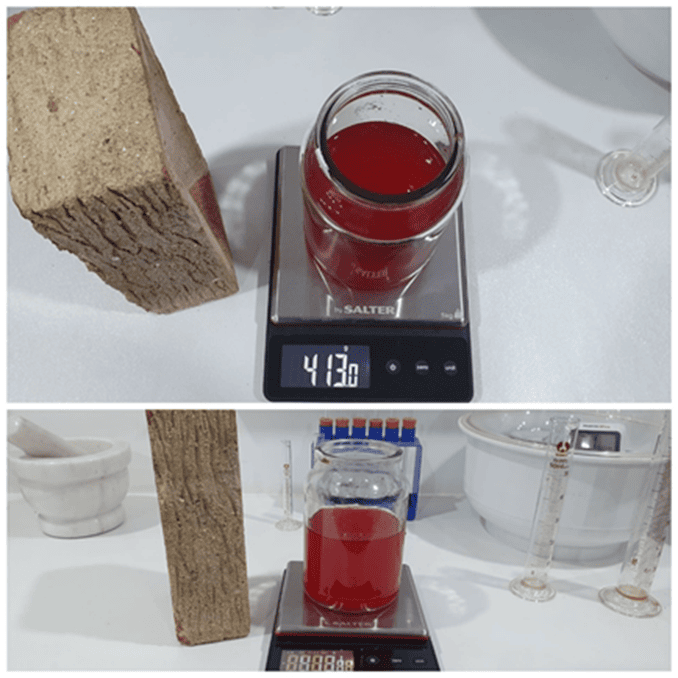
Figure 7 and 8: Results of LBC brick water uptake
The second-largest water uptake was by the solid farmhouse brick. The 21-day sample increased in weight by 249.5. The farmhouse brick is more of a common facing brick, being solid with no frog or indentations, and interestingly was the only brick that showed a slight difference between the long and short submersed samples. The 24-hour sample increased in weight by 165 grams.
However, this is not quite as straight forward as it first seems since the percentage weight increase was similar in both samples (they were not identical bricks, and each had a different starting weight). The 21-day sample increased in weight by 13% and the 24-hour sample increased in weight by 10 %. This would suggest that irrespective of the weight uptake difference that the 24-hour sample was likely saturated and the difference in gram uptake was probably due to the clay composition and capillary pore structure.
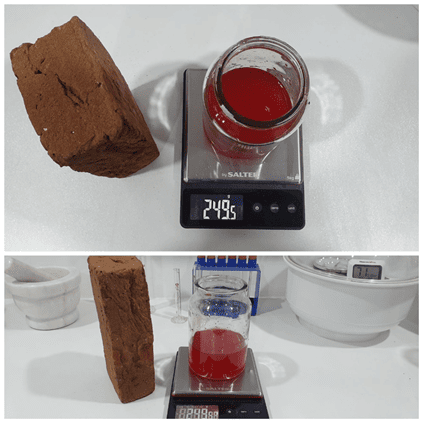
Figure 9 and 10: Solid farmhouse brick water uptake
The third-largest uptake (as expected) was the engineering brick. The 21-day sample increased in weight by just 168.5 grams vs 165.5 grams for the 24-hour sample indicating that irrespective of the submersion period, both samples were again saturated. The percentage weight increase, however, only equated to 8.1% for the 21-day sample and 7.8% for the 24-hour sample. Irrespective of their moderate weight increase as a percentage weight, the engineers absorbed less than 10% of their total weight. The reduced porosity of these bricks is the reason they are often specified below ground or below DPC level due to their moisture and frost resistant capabilities. Engineering bricks are fired at higher temperatures, so the clay matrix and aggregates start to melt together so there is less connected porosity, they are less permeable and hence they absorb less water.
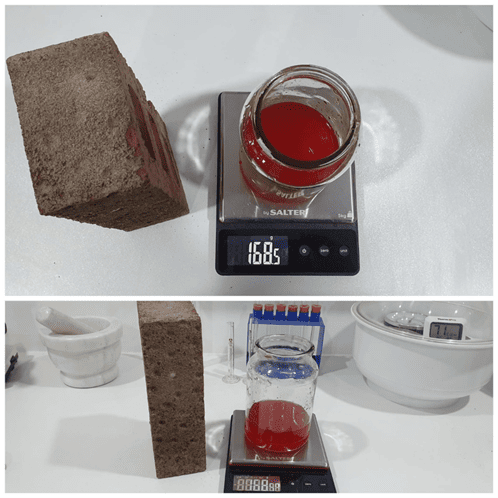
Figure 11 and 12: Engineering brick water uptake
Finally: the mortar sample. Each mortar sample had an uptake of just 28.5 grams per sample. However, the mortar samples had inevitably less mass than the bricks, therefore, a direct comparison in the grams of water uptake is unfair. As a percentage of their weight, the mortar samples increased in weight by 9.4% for the 21-day sample and 8.2% for the 24-hour sample. As such, the mortar samples had a similar percentage weight increase equivalent to the engineering bricks.
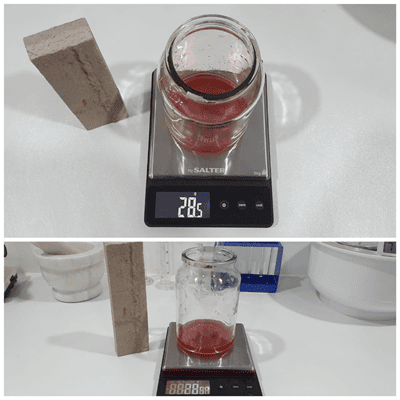
Figure 13 and 14: Mortar sample uptake
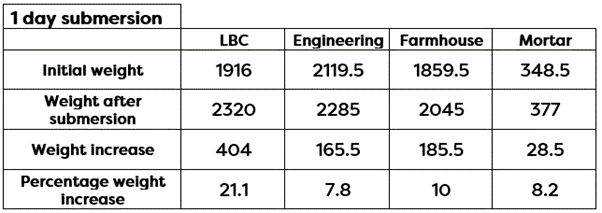
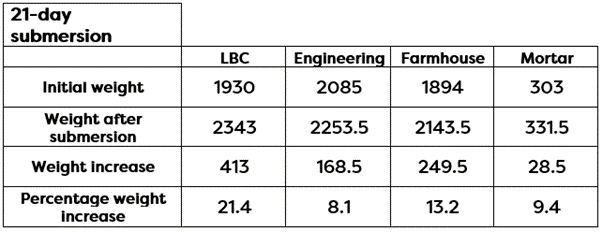
Figure 15: Water intake results for all samples
The drying process
Going back to the initial question, which of the brick samples would dry first: those submerged for just 24 hours, or those submerged for 21 days?
Over the following 63 days, I weighed, watched, and patiently waited as the samples slowly dried within the mild ambient conditions in the lab.
Following are the results and a plotted graph that shows the drying curve for each sample during the drying regime.
As expected, the first sample to dry was the mortar sample with both samples drying on day 10. The mortar sample had a water uptake considerably less than the bricks, however, its mass is also considerably less. Had I been able to source a sample of mortar the same mass as the bricks, then I would have expected its drying rate to have been similar to the engineering brick due to the similar percentage weight increases.
The second sample to dry was the engineering brick, with both samples drying in just 14 days. The similarities in the recovery duration highlight that irrespective of the submersion period, both bricks were equally saturated and dried at a similar rate (see drying curve below).
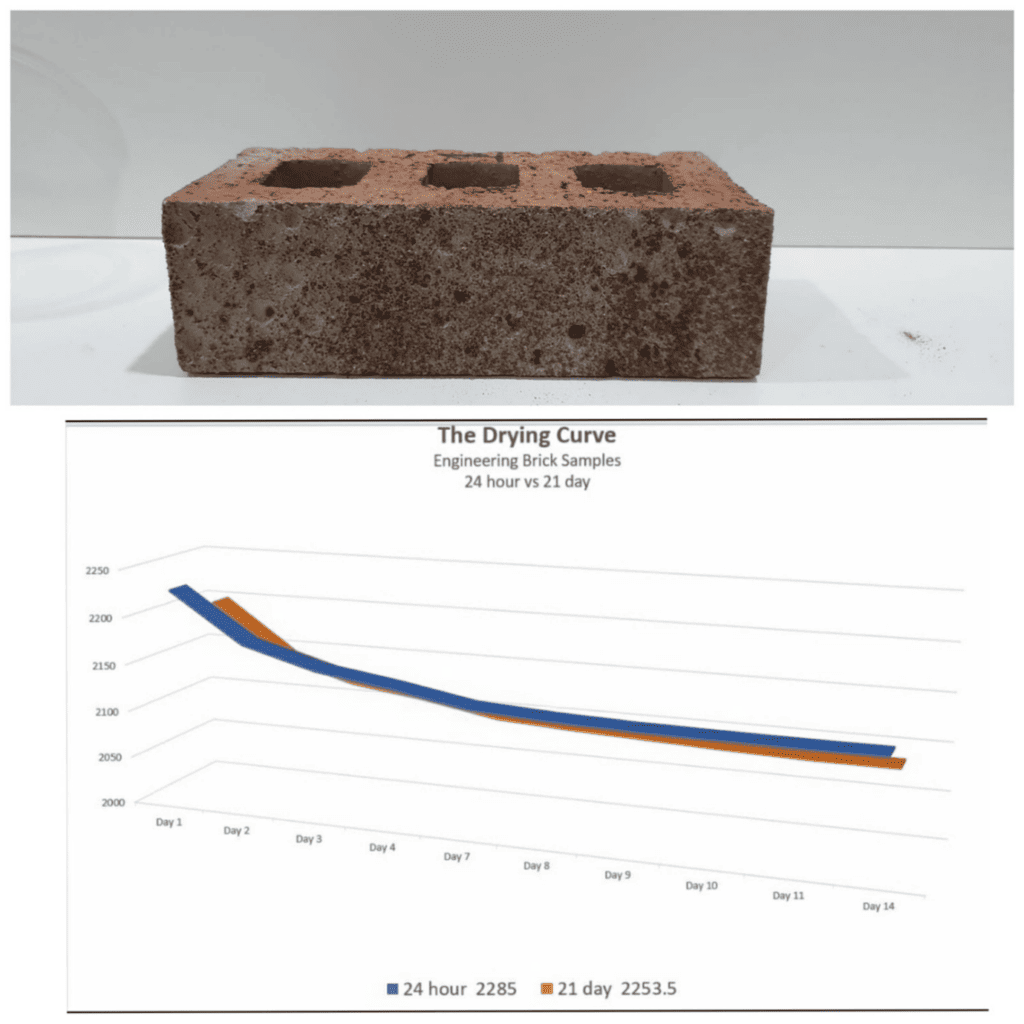
Figure 16: Drying curve of engineering brick
Surprisingly, the third brick to dry was the LBC facing brick. The LBC brick samples had the greatest water uptake of all materials in the test, however, they performed surprisingly well during the drying phase in their ability to release moisture quickly. The LBC brick submerged for 24 hours dried first within 25 days, followed closely by the 21-day submersion which dried within 26 days.
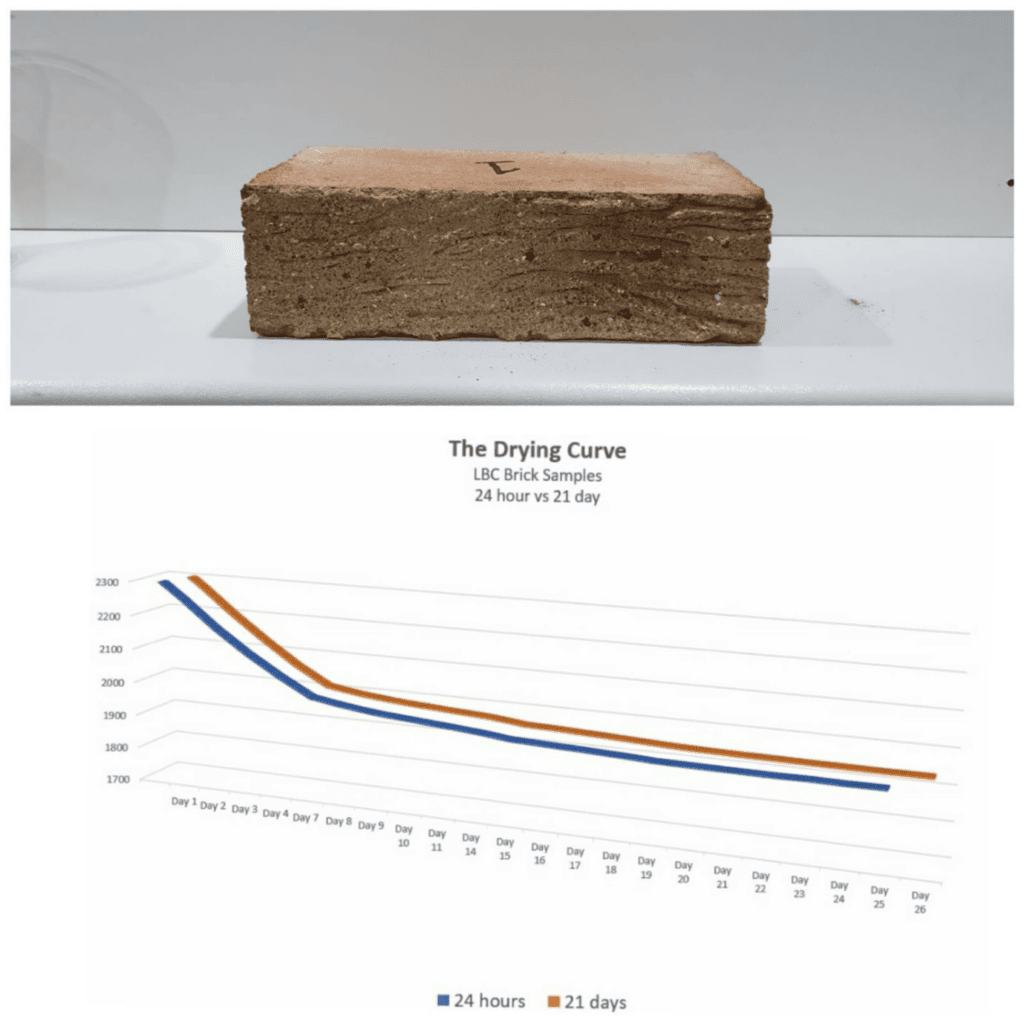
Figure 17: Drying curve of LBC brick
The poorest recovery was from the solid farmhouse brick. Although the farmhouse brick had a water uptake of almost 50% less than the LBC brick (10% vs 21.1%), it had a considerably slower drying rate. The first farmhouse sample to dry was actually the 21-day sample which dried within 47 days: that’s an additional 21 days of natural drying than the LBC and 33 days longer than the engineering brick.
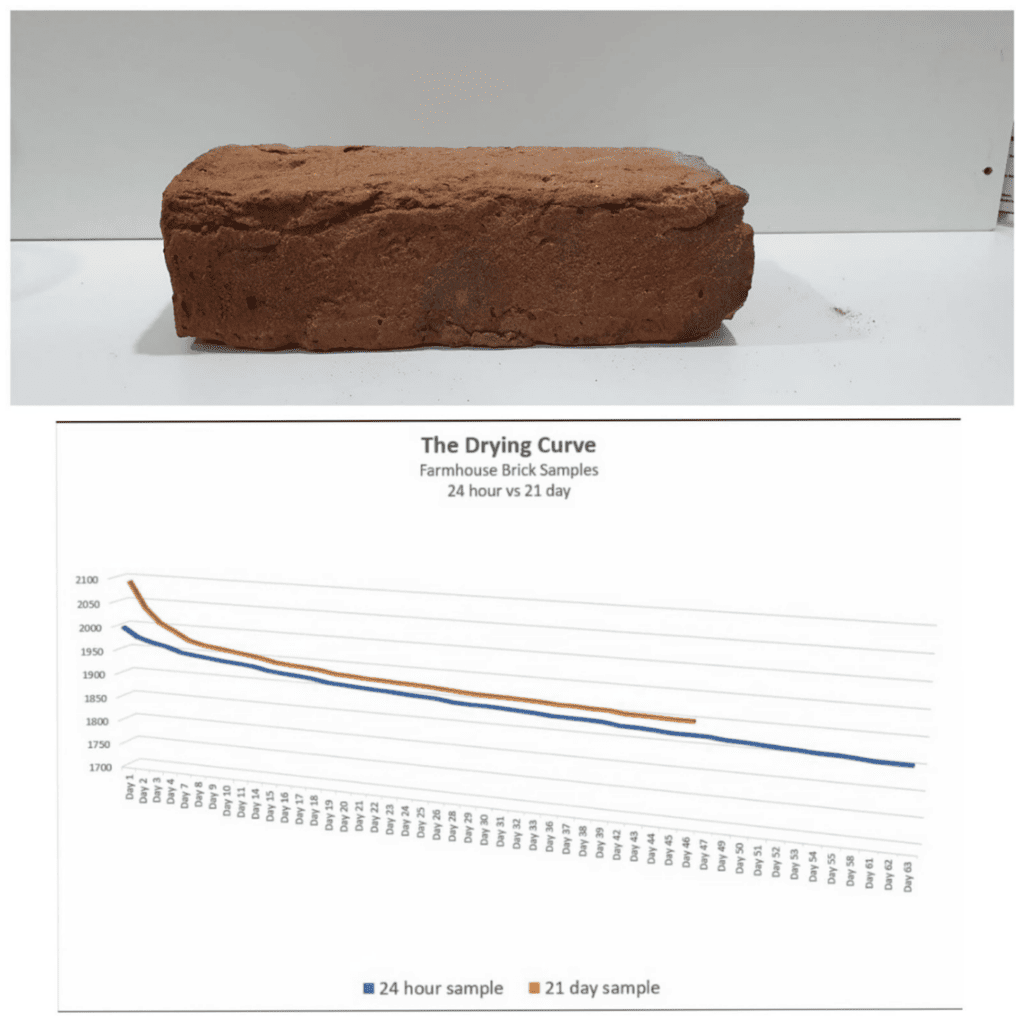
Figure 18: Drying curve of farmhouse brick
The recovery of the 24-hour sample was even slower. After 48 days the sample still hadn’t reached its drying goal and its weight loss halted 28 grams higher than its initial dry weight. I considered this was likely the ambient conditions in the lab which had changed due to a heatwave prior to the experiment. As such, to complete the experiment I introduced the final sample into an electronically controlled desiccant chamber. I set the conditions within the chamber to 35% RH at 20 degrees C and waited patiently as the sample slowly continued drying for another 15 days losing around 0.5-1 gram per day. Finally, after a staggering 63 days, the sample reached its drying goal.
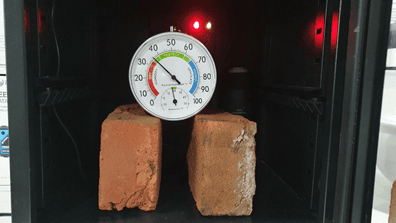
Figure 19: Farmhouse sample in electronically controlled desiccant chamber
So, why did the farmhouse brick have such a slow natural drying rate compared with LBC which had a far greater water uptake?
Well, I suspect this is probably due to multiple reasons. Firstly, the LBC brick, due to its incorporation of a frog, has less mass but a larger surface area exposed to the atmosphere. The larger surface area allows a greater rate of evaporation. Secondly, the pore structure and size are likely to have a big influence and inevitably appear much larger in the LBC, allowing for a faster evaporation rate.
This experiment was conducted predominantly without drying aids to highlight the natural drying/recovery of masonry materials affected by water. The aim was also to demonstrate that most masonry materials will saturate quickly, therefore, often the duration of the event has less influence on the drying and recovery of a water-damaged building. Factors such as construction methods, material selection, barriers to drying and a materials pore size and structure are of far greater importance.
Of course, in most water-damage/flood events, specialists will intervene and aim to recover the building at the earliest available opportunity to ensure damage limitation, allowing it to be restored and reoccupied as quickly as possible. This process is undertaken using forced drying systems and accelerated drying techniques. Drying professionals use their specialist knowledge and equipment which allows them to carefully balance temperature, humidity and airflow, which directly affects the state in which water exists, purposefully controlling the conditions for water-damaged materials to release their moisture in a controlled economical manner.
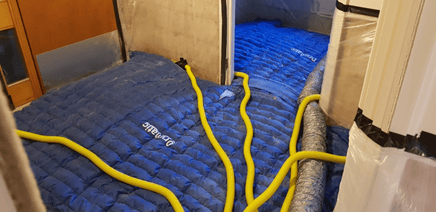
Figure 20: professional water removal following a flood
For evaporation to occur, a material must have sufficient energy to convert the liquid water to a gas resulting in a net loss of water from the material to the atmosphere. It sounds simple, however, these conditions have to be carefully managed as an imbalance in the system could lead to excessive evaporation resulting in a saturated environment and a failed drying regime. To do this effectively, drying specialists monitor and measure the reduction in specific humidity, often referred to as grain depression rather than other psychometric parameters that can be variable.
Clearly, in my experiment, the conditions in the lab during the final drying stage were different to those during the initial drying phase as I was unable to remove those last few grams of moisture from the 24-hour farmhouse brick without forcefully creating better ambient conditions. On reflection, the initial drying phase was during a lockdown, a period of prolonged and excessive heat and if I were to repeat the experiment, I would have monitored the conditions during the before and after phases. Although it doesn’t change anything, in hindsight, it would have been useful to have that data.
According to the data, the 24-hour farmhouse sample slowed under the natural conditions to 1887.5 grams in weight when its target drying goal was 1859.5 grams, a 28-gram difference. To meet its target drying goal, I needed to introduce energy to convert those last few remaining water molecules into a gas for evaporation to occur. Energy is required for this process, and to change just a pound of liquid water into vapour requires 940 BTUs (British Thermal Units). There are 453 grams per pound, thus 2.075 BTUs per gram. In total, the sample needed to lose 28 grams, therefore, an additional 58 BTUs of energy was required for the sample to reach its drying goal.
Scale it up
So, consider this. Let us briefly imagine we scale this scenario up. Think about the average semi-detached property with three external walls, a total of 21 linear metres of wall. The property is subject to an external flood up to the height of 600mm and is constructed from the LBC brick. The LBC brick in this experiment had a water uptake of 413 grams and 1 kilo of mortar is estimated for the laying of each brick.
LBC brick water uptake 413 grams
303g grams of mortar = 28.5 grams uptake / 1kg of mortar = 94.05g potential water uptake
21 linear meters of wall x 600mm high = 12.6 m2 wall
12.6 m2 x 60 bricks per m2 = 756 bricks which is also 756 kilos of mortar.
756 LBC bricks x 413 grams (water uptake) = 312,228g
756KG mortar x 94.05 grams (water uptake) = 71,102g
Total = 383,330g / 383.22 kilos or .383 tonnes
For some context, you could expect an average semi-detached property, when subject to a flood of water 600mm high, to have a water uptake of .383 tonnes within just the external leaf brickwork. That is the equivalent of a grand piano or two domestic pigs, and also doesn’t take into account the inner leaf of the cavity wall, wall insulation or the floor structure – that’s incredible!
Hopefully, this article has demonstrated and aided your understanding of what it really takes to dry down a water-damaged/flooded building and the length of time it can take for some materials to recover after a flood event.