SAP 10 – Changes to Heating Patterns.
In our last Technical Bulletin, we described the changes to the hot water calculations for SAP 10. In this issue, we will be taking a closer look at the changes to the heating patterns.
Background
As explained in our previous article, the Standard Assessment Procedure (SAP) methodology maintained by BRE is due to be defined and adopted following changes to the building regulations. Therefore, the current version, SAP 2012[1], will eventually be superseded by SAP 10[2].
Heating patterns in SAP
In simplified terms, you can see in figure 1 (below) how the heating patterns fit into the SAP calculation.
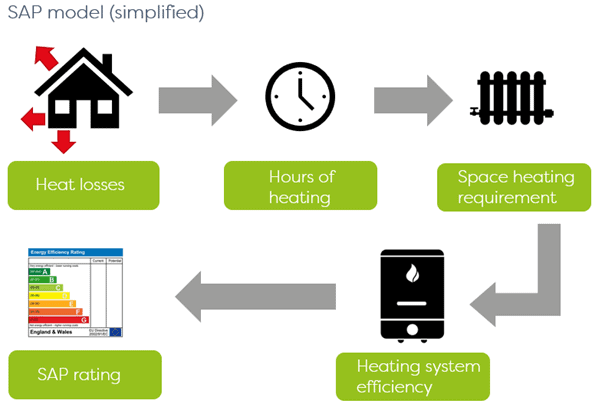
Figure 1 – SAP model heating calculation (simplified)
The dwelling’s heat losses are calculated first using the U-values of the windows, walls, roof and any ventilation losses. To work out the space heating requirement, the calculation then uses the hours of heating: the number of days, how long for and to what temperature. Additional heating hours will increase the space heating requirement. The methodology then uses the heating system efficiency to calculate the energy requirement, with fuel costs and CO₂ emissions factors, and the SAP rating and EI rating are generated.
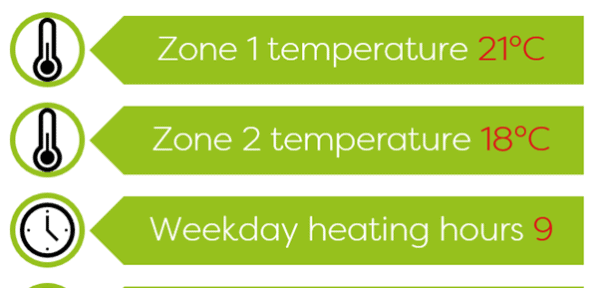
In SAP 2012, the heating season runs for 8 months from October through to May. The SAP model sets the zone 1 temperature (the dwelling living area) at 21°C and the zone 2 (the rest of the dwelling) at 18°C. On weekdays, the hours of heating are 9 hours – from 7am until 9am and from 4pm to 11pm. On the weekends, there is a single heating period of 16 hours a day from 7am until 11pm. This is based on the assumption is that occupants are at work Monday to Friday and at home on the weekends.
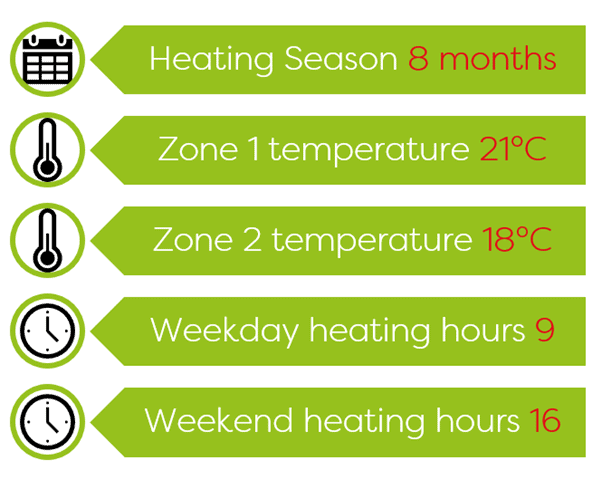
Figure 2 – SAP 2012 heating pattern
In SAP 10, the heating seasons and zone temperatures will not change, and the weekday heating hours will continue to be 9 hours per day. However, the weekend heating hours will be reduced to 9 hours per day, instead of 16 hours. This means that there will be 14 hours less heating per week during the heating season.
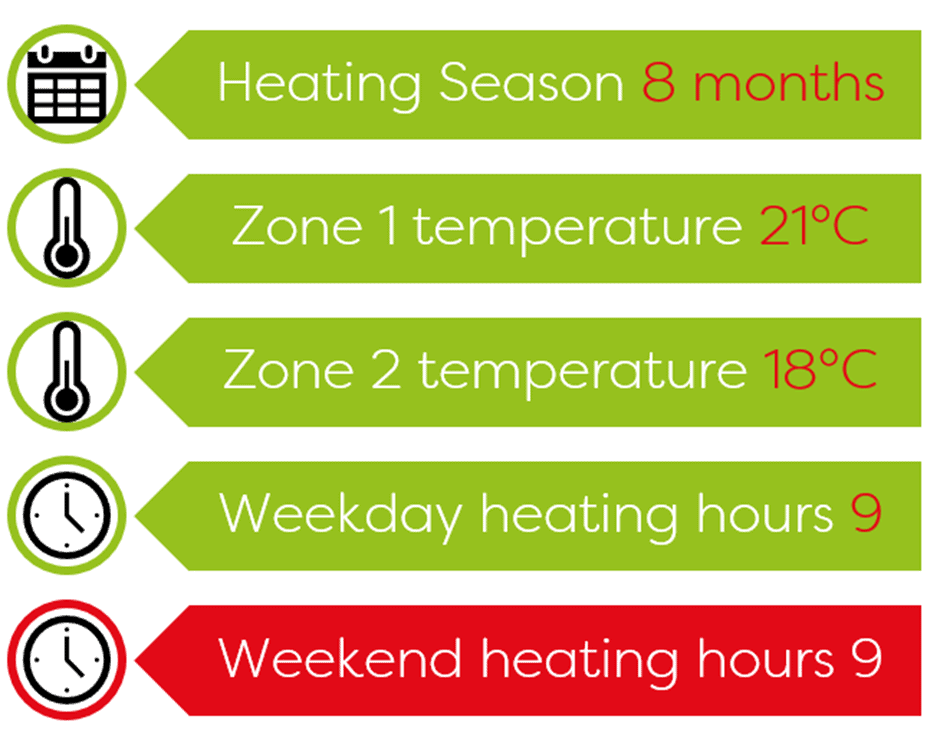
Figure 3 – SAP 10 heating pattern
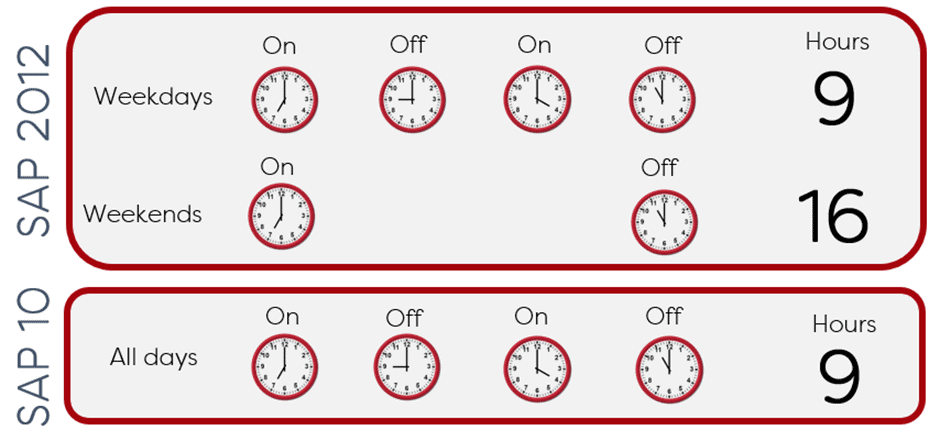
Figure 4 – SAP 2012 heating patterns vs SAP 10 heating patterns
Why change?
The SAP heating patterns have not changed since the first edition of SAP which was published in 1993. In 2011, the Energy Follow up Survey (EFUS)[1] was carried out to supplement the English Housing Survey (EHS) 2010/2011[2] which compiled information from 13,300 homes. The EFUS collected data from a sub-set of 2616 households that were part of the EHS, and the report was published in 2014. The households had temperature loggers placed in three separate rooms which recorded room temperatures every twenty minutes for around one year, and electricity consumption monitors were installed to provide information on how much electricity and gas was actually being used. In addition, a sub-sample of 79 homes had electricity profiling equipment installed which examined patterns of lighting, appliance and electrical cooking use. Using these measures, the survey was able to accurately analyse actual gas and electricity usage for these households and data from both the EFUS and the EHS were combined, providing a richer data source for analysis.
The survey results showed that nearly 70% of respondents reported they did not have a different heating pattern on the weekend, probably reflecting the change in modern living and working patterns. For instance, more companies are offering flexible working hours and the evolution of technology and meeting software allows people to work from home. On the weekends, people may be out shopping, especially since many shops are open later and on Sundays. The fitness industry is continually growing, and cheaper gym memberships and 24-hour gyms mean more people are able to join the gym and go in out-of-office hours. Interestingly, the survey also reported that there was only a small difference between daytime occupied households who had the heating on for 9.4 hours a day and households that were not at home during the day who had the heating on for 8 hours. This is contrary to the belief that householders who were at home all day had the heating on all day.
How much difference does it make?
The 8-month heating season means there are 69 weekend days and 174 weekday days. Using SAP 2012 heating patterns, that adds up to 2670 annual heating hours. Using the SAP 10 heating pattern, there are 2187 annual heating hours, reducing the heating hours by 483 annually, giving an 18% reduction.
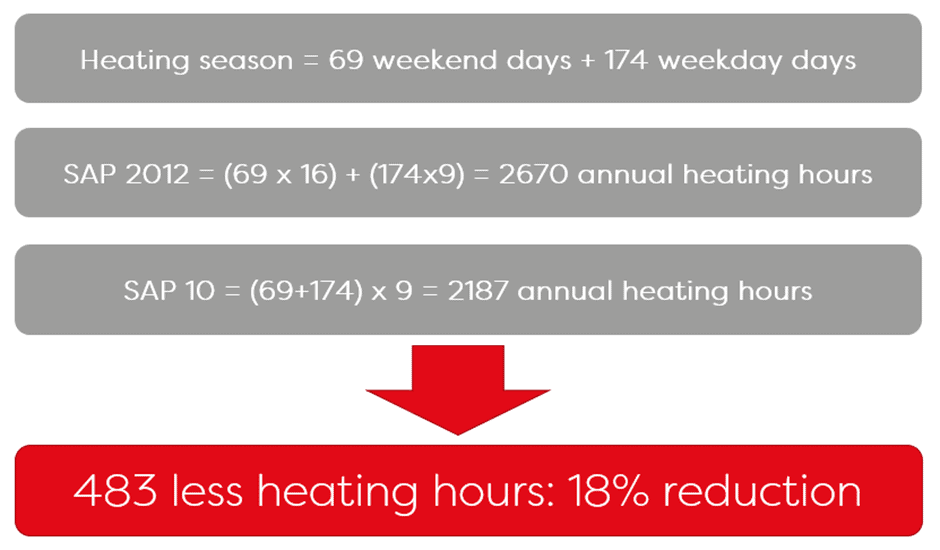
Figure 5 – Heating pattern difference
We were able to estimate the impact on the SAP rating of this change to the heating hours by altering only the heating pattern in the SAP 2012 model. We found that, in isolation, this change to the SAP model increased the SAP rating by 1-5 SAP points, the greater increase for unresponsive heating systems.
With an unresponsive system such as storage heaters, the dwelling is often overheated by overshooting the 21° as the system isn’t well controlled. Therefore, the reduction in heating hours will have a bigger impact on such systems.
Summary
We found that the heating hour reduction in SAP 10 is likely to impact poorly insulated properties with unresponsive heating systems in comparison to efficient properties with a responsive heating system where the increase in the SAP rating was less pronounced. Our analysis looked at the heating pattern change in isolation and found an increase in the SAP. Some of the other additions to the SAP methodology will have a converse effect. You can try SAP 10 for yourself using BRE’s iSAP here: https://www.isap.org.uk/. Their software enables you to model both SAP 2012 and SAP 10.
Although the SAP 10 specification is published, SAP 10 will not be in use until after the Building Regulations Part L consultation which is expected to take place this year. It is likely that following the consultation, there may be amendments to the published SAP 10 methodology.
[1] https://www.bregroup.com/sap/standard-assessment-procedure-sap-2012/
[2] https://www.bregroup.com/sap/sap10/
[3] https://www.gov.uk/government/statistics/energy-follow-up-survey-efus-2011
[4] https://www.gov.uk/government/statistics/english-housing-survey-homes-report-2010